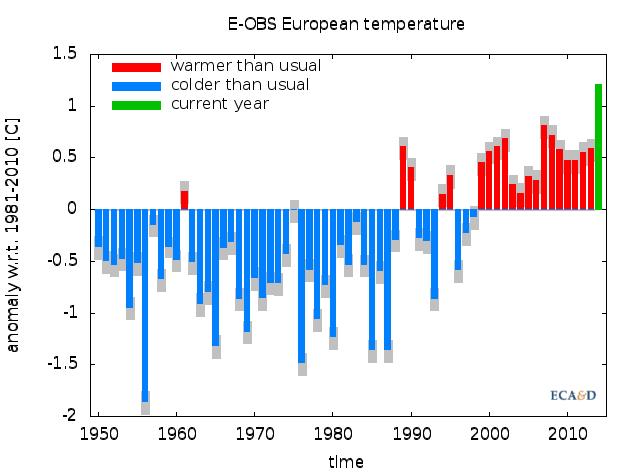
A new analysis of European temperature data from January through November 2014 confirms that 2014 will almost certainly be the region’s warmest year on record. Initial estimates forecast the January-December annual mean temperature for Europe to be 0.3°C above the previous record set in 2007. The top-10 of warmest years includes all the years from the year 2000 onward, with 1989 as the only exception, at sixth place.
A European perspective on this hot year is provided via the Climate Indicator Bulletin. It includes a statement on the attribution of this warmth, which is the focus of a separate press release from Climate Central. The analysis was conducted through the European Climate Assessment & Dataset project by a consortium of national weather services, the IEG EUMETNET, and leading research institutes. It was coordinated by the Royal Netherlands Meteorological Institute (KNMI) and constitutes an output of the WMO Regional Climate Center – Network for Europe.
50-70 times more CO2 and air pollution per kWh than wind.
Methane from natural gas is a main contributor to Arctic ice loss.
Natural gas causes more global warming but less air pollution mortality than coal over 150 years due to less sulfate (a cooling agent) and more methane (a warming agent) from natural gas than coal.
Coal causes higher mortality. Hydrofracking causes land and water supply degradation
Why Not Clean Coal (With Carbon Capture)?
50 times more CO2 emissions per kWh than wind.
150 times more air pollutant emissions per kWh than wind
Requires 25% more energy, thus 25% more coal mining and transport and traditional pollution than normal coal.
Why Not Nuclear?
9-25 times more pollution per kWh than wind from mining & refining uranium and using fossil fuels for electricity during the 11-19 years to permit (6-10 y) and construct (4-9 y) nuclear plant compared with 2-5 years for a wind or solar farm
Risk of meltdown (1.5% of all nuclear reactors to date have melted)
Risk of nuclear weapons proliferation Unresolved waste issues
Why Not Ethanol?
Corn and cellulosic E85 cause same or higher air pollution as gasoline
Corn E85: 90-200% of CO2 emissions of gasoline
Cellulosic E85: 50-150% of CO2 emissions of gasoline
Tshoki Zangmo, del Centro Studi nazionale del Buthan, spiega il calcolo dell’Indice di Felicità Lorda e come il benessere dei cittadini guida le politiche del governo
“Il Pil misura tutto, in breve, eccetto ciò che rende la vita veramente degna di essere vissuta”. Era il 1968 quando Robert Kennedy tenne il suo discorso sul Prodotto interno lordo: l’anno delle prime rivolte operaie, dell’assassinio a Memphis di Martin Luther King e dell’istituzione, da parte della Banca di Svezia, del premio Nobel per l’Economia.
Quarantasei anni dopo il mondo è completamente diverso, eppure ancora ci si interroga sull’opportunità di affidare al Pil la misura del benessere della società in cui viviamo. L’attenzione però si è spostata dal mondo occidentale verso Oriente. Dopo una breve parentesi europea con l’esperienza della Commissione Stiglitz nel 2009, lo studio dell’Economia della Felicità è tornato appannaggio di un piccolo Stato montano nel cuore dell’Asia: il Regno del Buthan…